Department of Mobility and Infrastructure
Section 35 · Pages 227–237 · 4 tables · includes narrative
Key changes
- Staffing unchanged at 126 FTE
On this page
Department of Mobility and Infrastructure
 Department of Mobility and Infrastructure
Mission
The mission of the Department of Mobility and Infrastructure is to provide the physical mobility necessary to enable the social and economic mobility of the people of Pittsburgh through the management, design, improvement and operation of the public rights of way.
Departmental/Bureau Overview
- The Department of Mobility and Infrastructure is responsible for all aspects of transportation and city- provided mobility services, including:
- Planning transportation and mobility systems, corridors, and network operations
- Managing the flow of infrastructure funding
- Developing policies to guide the use of public right-of-ways and management of transportation systems
- Managing the public right-of-way to ensure continued safe, efficient and productive use that respects and implements city policies and public priorities
- Designing, operating and maintaining the transportation system for safe and efficient mobility of all modes to sustain and grow a vital, thriving, and equitable Pittsburgh
- Designing and implementing street and other infrastructure improvements in collaboration with community and public stakeholders
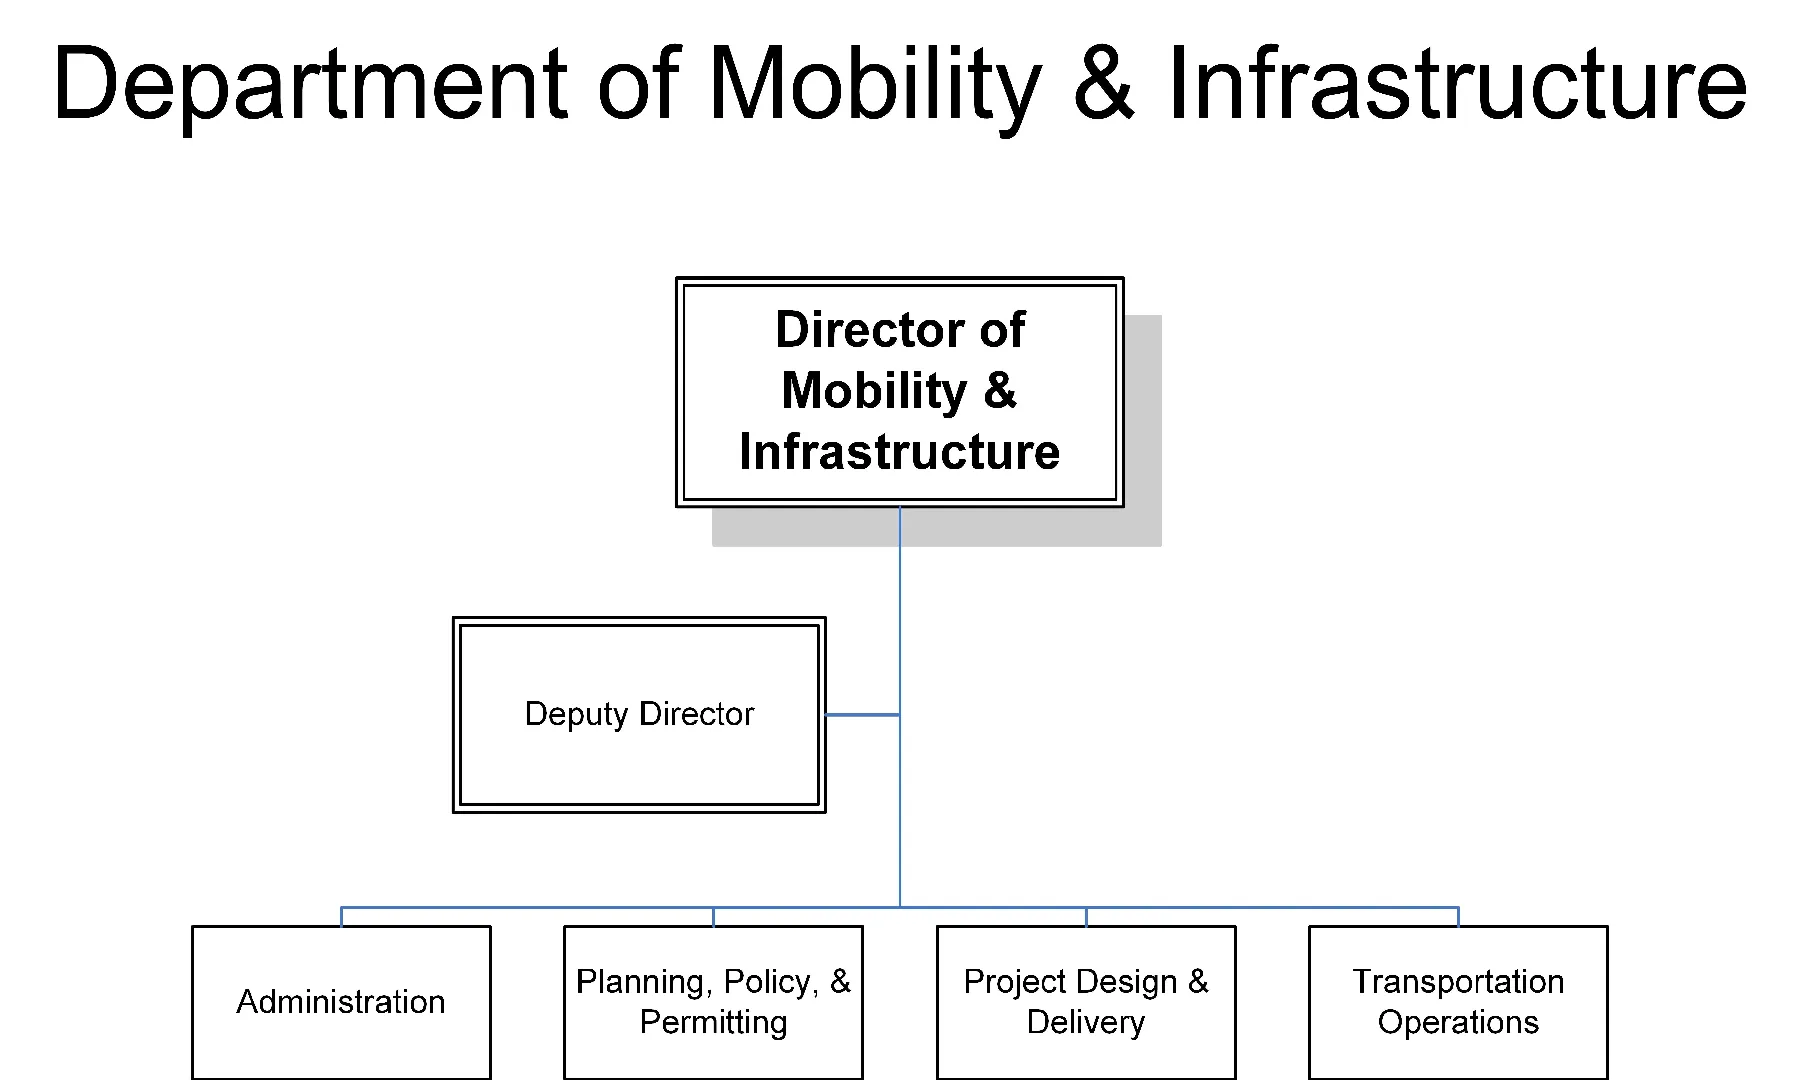
- Measuring and monitoring mobility performance with the goal of continuous learning and improvement The Department of Mobility and Infrastructure (DOMI) is comprised of four bureaus: Planning and Development Review -
- Planning - Oversees development of system plans and multimodal networks and collaborates on implementation; develops conceptual design of transportation facilities; gathers and analyzes data on the condition and use of the mobility system; coordinates with county and regional organizations and entities to plan transportation infrastructure improvements and mobility systems; and serves as the initial point of contact for public stakeholders and partners for general mobility concerns or initiatives. Additionally, the planning division tracks development of the regional Transportation Improvement Program (TIP), development of the department’s submission to the city’s Capital Improvement Plan, and pursuit of grants and other resources to support implementation of the transportation program.
- Development Review - Reviews transportation and right-of-way elements associated with a proposed development or redevelopment in close coordination with the Department of City Planning and the Department of Permits, Licenses, and Inspections. Identifies the impact(s) of proposed developments on the transportation network and recommends improvements and transportation demand management strategies to mitigate impacts through transportation engineering and planning. Policy and Permitting - The Planning, Policy and Permitting Bureau is led by the Assistant Director and establishes the comprehensive vision, guiding policies and permitted uses of the urban mobility network and public rights of way. It is comprised of two divisions:
- Policy - Develops, communicates and maintains policies for the use, management, design and oversight of public mobility services, transportation facilities and public rights of way; manages demand on the mobility system; and develops and maintains guidelines, standards, and processes for the use of public rights of way and the operation of the system and mobility services.
- Permitting, Inspections and ROW Coordination - Issues permits for use of or activities in the public rights of way in compliance with regulations and established policies; coordinates current and future activities with public and private utilities occupying the public rights of way; and enforces right of way use to ensure all activities in the public right of way are in compliance with established rules and regulations and the Pittsburgh Code via the inspection process. The Permit Division coordinates the activities of utilities in the public right of way to minimize disruption and optimize opportunities for cooperative improvements.
Project Design and Delivery - The Project Design and Delivery Bureau is led by the Chief Engineer. The Bureau is responsible for all of the major capital improvement projects for transportation or mobility infrastructure. This includes not only street and bridge work, but also providing engineering services to address major slope failure and flood control needs in the city. The Bureau is comprised of five divisions:
- Bridges and Structures Division - The Bridges and Structures Division manages structural assets in the right-of-way including bridges, steps, and retaining walls. This work includes repair design, capital planning, and implementation of capital rehabilitation and replacement projects from design through construction. The division performs or contracts for condition inspection of structures in the public right of way to ensure the safety of the traveling public.
- Streets Division - The Streets Division manages city streets, sidewalks, and trails that comprise the city’s transportation network. Streets Division engineers manage preliminary and final engineering for complex public infrastructure projects and construction services provided by City contractors. The Division supports the Permit Division through review of restoration or alteration of the public right of way carried out by private developments. Project Managers develop and maintain standards and specifications for construction in the public right of way.
- Paving Division - The Paving Division oversees City resurfacing projects on public streets, trail facilities and other public paved surfaces and the improvement of sidewalk ramps affected by this work. The Division is responsible for resurfacing dozens of miles of streets every year in the city.
- Construction Division - The Construction Division of the Department of Mobility and Infrastructure addresses immediate needs for typically smaller scale improvements of infrastructure in the public rights of way. The Division oversees work to repair, replace or rehabilitate curbs, sidewalks, curb ramps, steps, walls, slopes and other similar projects. Division managers respond to emergency events that disrupt the safe operation of the mobility system such as landslides, sink holes, and bridge strikes.
- Bridge Maintenance Division - The Bridge Maintenance Division performs routine maintenance and small repairs using in-house staff for the city’s inventory of 145 bridges. The division also oversees and inspects bridge repair work performed by city contractors. Traffic Bureau - The Traffic Operations Bureau is led by the Municipal Traffic Engineer and oversees the operation of the overall transportation and mobility network. The Bureau includes four divisions:
- Traffic Design Division - The Design Division develops design standards and guidelines for transportation facilities including travel way dimensions, assemblage, operation, markings, signage, and other components. The Division is central in the determining design of facilities for vehicles, bicycles and pedestrians. It provides programmatic guidance for complete street, safe routes to school and traffic calming improvements.
- Signal Design Division – The Signal Division is responsible for designing the programming and operational plans for more than 600 signalized intersections throughout the city and designing plans for other devices such as school zone signs, rapid flash beacons, variable signs, and other elements. The Design Division assists the Planning Bureau in reviewing land development projects and specifically evaluating transportation impacts and necessary mitigations.
- Signs and Markings Division - The Signs and Markings Division fabricates, installs, repairs and/or replaces pavement markings, and signage. It is responsible for striping more than 2,000 miles of long markings, 10,000 marked crosswalks, and 850 traffic control and curbside regulatory signs. The Signs and Markings Division is typically responsible for the implementation of designs generated by the Design Division.
- Traffic Control Division - The Traffic Control Division performs necessary and routine maintenance on more than 10,000 traffic signal heads and other electronic traffic control devices across the City to keep them in operation. The three Bureaus of the Department of Mobility and Infrastructure are collectively responsible for:
- 1,060 linear miles of streets (890 asphalt, 90 concrete, 80 brick/block stone)
- 2,423 lane miles of streets (2,034 asphalt, 206 concrete, 183 brick/block stone)
- Tens of thousands of crosswalks and pavement markings
- 144 bridges (96 vehicle, 48 pedestrian) 230
- 833 retaining walls
- 1216 sets of steps (464 structural, 753 on-grade)
- 44,000 street lighting fixtures
- 660 signalized intersections
- 850,000 street signs
- 33 miles of guide rail 2026 Accomplishments The Planning, Policy, and Permitting Bureau, led by the Department’s Assistant Director,
- 3 new bus shelters installed as part of the Transit Stop Improvement Program, serving approx. 100 average daily riders
- Lawrenceville Mobility Enhancement District received over 175K in the first full year with another 300k expected to be raised in 2026 and 130K worth of construction ongoing.
- In collaboration with DCP and PLI, completed overhaul of the Vending Program, streamlining permitting process and expanding opportunities for small businesses.
- As of October 2026, there were 15,000 citations issued for violations of Smart Loading Zones and 17,000 citations for illegal parking in no parking areas or bike lanes. Over 65,000 users are registered for CurbPass (Smart Loading Zone payment app), representing a 25% increase since 2025.
- Completed Three Rivers Heritage Trail Maintenance & Management Plan
- Completed West Pittsburgh Mobility Plan & secured additional funding to design two key community priority corridors.
- Completed S. Neville/Boundary St. Streetscape Plan.
- Completed 2nd State of Mobility Report fulfilling Complete Street policy requirements.
- Completed installation of all Phase 1 ARLE locations.
- Completed complex intersection study- Brighton Heights Blvd- California Ave- Termon Ave
- As of October 2026, DOMI has issued over 10,000 permits for work in the right-of-way and conducted over 33,000 inspections with 1,400 requests for compliance (i.e. citations) issued. The Project Design and Delivery Bureau, led by the City’s Chief Engineer
- By providing the tools for assessment, we have helped community volunteers evaluate more than 7,000 sidewalk segments feeding into project selection. (sidewalk dashboard)
- DOMI Structures Staff completed 181 retaining wall condition assessments in 2026 to wrap up the 2-year initiative to catalog the general condition of all City identified retaining walls in the ROW.
- DOMI Construction worked with on-call Contractor to replace 5 sets of steps throughout the City.
- Taking the past five years as an average, the Streets group has invested over a million dollars per year in Sidewalk Gap projects, rebuilding or expanding our sidewalk network by several miles each year
- In the past two years we have been working on targeted transit stop improvements in collaboration with the PPP group which has resulted in six locations where sidewalk was built and conduit laid in preparation for bus shelter installation, with several more planned to go in this year depending on weather. Working with the Traffic team, several of the transit stop improvement projects have additionally included signage and pavement marking improvements, making them closer to intersection redesigns.
- In the last 5 years, the Structures unit has spent $8.715 M on bridge repairs. $4.752 M has been spent on 266 work orders for day-to-day maintenance and emergency priority repairs through our on-call contractor. $3.727 M has been spent on large scale projects (Panther Hollow, Swindell). Our new Bridge maintenance division has tackled 248 work orders in the last two years including much of the deck washing work that we were unable to do before.
- In the past five years, DOMI has mitigated 59 high-priority bridge deficiencies, including all of the “Priority 0” items. When the city’s inventory was evaluated in 2022, there were 27 outstanding “Priority 0” items and 69 “Priority 1” items. Of those items, there are no remaining 0s and 44 of the Priority 1 items have been completed and 12 more have been scheduled for repair.
- For flood mitigation we are working to expand our flood mitigation work in-house but we have done four co-op projects with PWSA (Braywood, Dragoon, Stewart, Haverhill) that have been very successful street/ stormwater overlaps. 231
- DOMI is wrapping up the completion of a key action item of the Comprehensive Steps Asset Management program. Using the 2018 step assessment variable scoring and step Overall Score logic PDD, PPP & I&P updated the variable scores and Overall Score for all City steps. This work will allow DOMI to make data driven investments into the Step Inventory as a whole.
- In 2026 the City safely demolished an abandoned bridge in Critical Condition, saving Operation budget by eliminating the need for annual inspection and repairs.
- Two major streetscape projects began construction - Penn Ave Phase 2 and Smithfield Street
- Completed two major landslide remediation projects – Ruthven St & Herndon Ave
- Installed 805 handicap ramps.
- Serviced 45 street with various infrastructure upgrades.
- We will crack seal an estimated 70 streets in 2026.
- 346,000 square yards or 26.61 miles of paving by the city/city contractors. We will pave up to 11/25/26 or until we exhaust funding. When completed, we will have paved 29.3 miles for 2026. The Traffic Bureau, led by the City’s Municipal Traffic Engineer,
- Our traffic calming projects reduce 85th percentile speeds by an average of 7.5 Miles per hour (2025 projects data on traffic calming page)
- Where we’ve implemented traffic calming, we’ve reduced the percent of drivers who speed by more than 40% (2025 projects)
- On some streets traffic calming has reduced the 85th percentile speed from 38 mph to 25 mph and dropped the percentage of people speeding by 78%
- Number of Participants at Walk and Roll to School Day(s) this year
- Spring 2026 Walkers: 482 Bike/Rollers: 201
- Fall 2026 Walkers: 484 Bike/Rollers: 256
- New signals have shown a 33% reduction in crashes at those intersections.
- Warnings sent in the first 60 day warning period of ARLE
- Almost 7,000 warnings issued in the first 60 days, with another 4,500 pending review.
- Finished upgrading the City’s Street Light inventory to LED.
Position Summary
Lists authorized positions with FTE counts and pay grades.
| Title | 2026 FTE | Rate/ Grade | Hours/ Months | 2026 Budget | 2027 FTE | Rate/ Grade | Hours/ Months | 2027 Budget |
|---|---|---|---|---|---|---|---|---|
| Director of Mobility & Infrastructure | 1 | 35G | 12 | 132,995 | 1 | 35G | 12 | 136,989 |
| Deputy Director | 1 | 33G | 12 | 120,827 | 1 | 33G | 12 | 124,446 |
| Fiscal Supervisor | 1 | 27G | 12 | 93,746 | 1 | 27G | 12 | 96,554 |
| Vision Zero & Engagement Manager | — | 25G | — | — | 1 | 25G | 12 | 88,587 |
| Operations Manager | — | 24G | — | — | 2 | 24G | 12 | 170,436 |
| Infrastructure Engagement and Performance Operations Manager | 1 | 22G | 12 | 76,294 | — | 22G | — | — |
| Vision Zero Coordinator | 1 | 22G | 12 | 76,294 | — | 22G | — | — |
| Contract Administrator | 1 | 70,377 | 12 | 70,377 | 1 | 72,489 | 12 | 72,489 |
| Operations Coordinator | — | 20G | — | — | 1 | 20G | 12 | 72,301 |
| Executive Assistant | 1 | 19G | 12 | 67,288 | 1 | 19G | 12 | 69,306 |
| Operations & Administrative Coordinator | 1 | 62,066 | 12 | 62,066 | — | 63,982 | — | — |
| Press Officer | 1 | 17G | 12 | 61,922 | 1 | 17G | 12 | 63,773 |
| Fiscal & Contracting Coordinator | 2 | 59,445 | 12 | 118,890 | 2 | 61,229 | 12 | 122,457 |
| Technician, Payroll | 3 | 48,150 | 12 | 144,450 | 2 | 49,595 | 12 | 99,190 |
| Assistant Director - Development Review & Planning | 1 | 32G | 12 | 114,046 | 1 | 32G | 12 | 117,458 |
| Assistant Director - Policy & Permitting | — | 32G | — | — | 1 | 32G | 12 | 117,458 |
| Senior Manager Right of Way | 1 | 29G | 12 | 101,525 | — | 29G | — | — |
| Senior Planning Manager | 1 | 29G | 12 | 101,525 | 1 | 29G | 12 | 104,562 |
| Senior Manager ROW Operations | — | 29G | — | — | 1 | 29G | 12 | 104,562 |
| Utility & Right of Way Supervisor | 1 | 27G | 12 | 93,746 | — | 27G | — | — |
| Project Manager | 1 | 27G | 12 | 93,746 | 1 | 27G | 12 | 96,554 |
| Data Solutions Architect | 1 | 27G | 12 | 93,746 | 1 | 27G | 12 | 96,554 |
| Right of Way Manager | 1 | 27G | 12 | 93,746 | 1 | 27G | 12 | 96,554 |
| Inspection Supervisor | 1 | 25G | 12 | 86,008 | 1 | 25G | 12 | 88,587 |
| Paving & Utility Coordinator | — | 25G | — | — | 1 | 25G | 12 | 88,587 |
| Operations Manager | 1 | 24G | 12 | 82,742 | 1 | 24G | 12 | 85,218 |
| Curbside & Mobility Services Program Manager | 1 | 24G | 12 | 82,742 | 1 | 24G | 12 | 85,218 |
| Safe Routes to School Coordinator | 1 | 23G | 12 | 79,352 | 1 | 23G | 12 | 81,723 |
| Principal Planner | 3 | 76,476 | 12 | 229,428 | 2 | 78,771 | 12 | 157,542 |
| Transportation Demand Management Coordinator | 1 | 22G | 10 | 63,579 | 1 | 22G | 12 | 78,592 |
| Senior Planner | 3 | 73,545 | 12 | 220,635 | 3 | 75,751 | 12 | 227,253 |
| Inspector 3 | 2 | 20G | 12 | 140,400 | 1 | 20G | 12 | 72,301 |
| Policy Analyst | 2 | 20G | 12 | 140,400 | 2 | 20G | 12 | 144,602 |
| Program Analyst | 1 | 20G | 12 | 70,200 | 1 | 20G | 12 | 72,301 |
| Engineering Technician 3 | 2 | 20G | 12 | 140,400 | 2 | 20G | 12 | 144,602 |
| ROW Construction Inspector | 7 | 66,256 | 12 | 463,792 | 7 | 68,244 | 12 | 477,708 |
| Lead Technician, Mobility | 1 | 60,330 | 12 | 60,330 | 1 | 62,140 | 12 | 62,140 |
| Technician, Mobility | 4 | 50,954 | 12 | 203,816 | 4 | 52,482 | 12 | 209,928 |
| Code Enforcement Inspector | 2 | 61,936 | 12 | 123,872 | 2 | 63,794 | 12 | 127,588 |
| Chief Engineer | 1 | 33G | 12 | 120,827 | 1 | 33G | 12 | 124,446 |
| Deputy Chief Engineer - Structures | 1 | 31G | 12 | 109,678 | 1 | 31G | 12 | 112,965 |
| Senior Project Manager | 2 | 29G | 12 | 203,050 | 2 | 29G | 12 | 209,124 |
| DOMI Construction Superintendent | — | 29G | — | — | 1 | 29G | 12 | 104,562 |
| Project Manager | 3 | 27G | 12 | 281,238 | 3 | 27G | 12 | 289,662 |
| Paving Supervisor | 1 | 27G | 12 | 93,746 | 1 | 27G | 12 | 96,554 |
| Construction Supervisor | 1 | 27G | 12 | 93,746 | — | 27G | — | — |
| Bridge Maintenance Supervisor | 1 | 27G | 12 | 93,746 | 1 | 27G | 12 | 96,554 |
| Project Engineer | 3 | 23G | 12 | 238,056 | 3 | 23G | 12 | 245,169 |
| Inspector 4 | 1 | 21G | 12 | 73,258 | 1 | 21G | 12 | 75,462 |
| Bridge Maintenance Foreman | 1 | 74,069 | 2,080 | 74,069 | 1 | 75,546 | 2,080 | 75,546 |
| Staff Engineer | 3 | 71,414 | 12 | 214,242 | 3 | 73,556 | 12 | 220,668 |
| Paving Foreman | 1 | 71,822 | 2,080 | 71,822 | 1 | 73,258 | 2,080 | 73,258 |
| Inspector 3 | 2 | 20G | 12 | 140,400 | 2 | 20G | 12 | 144,602 |
| Cement Finisher | 1 | 31.36 | 2,080 | 65,229 | 1 | 32.61 | 2,080 | 67,829 |
| Structural Iron Worker | 1 | 31.36 | 2,080 | 65,229 | 1 | 32.61 | 2,080 | 67,829 |
| Inspector 2 | 1 | 59,210 | 12 | 59,210 | — | 60,986 | — | — |
| General Laborer | 1 | 27.64 | 2,080 | 57,491 | 1 | 28.75 | 2,080 | 59,800 |
| Survey Party Chief | 1 | 15G | 12 | 56,618 | 1 | 15G | 12 | 58,323 |
| Fiscal Coordinator | 1 | 52,895 | 12 | 52,895 | 1 | 54,482 | 12 | 54,482 |
| Inspector 1 | — | 49,280 | — | — | 2 | 50,758 | 12 | 101,516 |
| Assistant, Land Survey Rod Specialist | 1 | 47,250 | 12 | 47,250 | 1 | 48,668 | 12 | 48,668 |
| Municipal Traffic Engineer | 1 | 32G | 12 | 114,046 | 1 | 32G | 12 | 117,458 |
| Senior Project Manager | 1 | 29G | 12 | 101,525 | 1 | 29G | 12 | 104,562 |
| Traffic Supervisor | 2 | 27G | 12 | 187,491 | 2 | 27G | 12 | 193,108 |
| Project Manager | 5 | 27G | 12 | 468,730 | 4 | 27G | 12 | 386,216 |
| Intelligent Transportation Systems Technology Manager | 1 | 27G | 12 | 93,746 | 1 | 27G | 12 | 96,554 |
| Traffic Management Center Supervisor | 1 | 24G | 12 | 82,742 | 1 | 24G | 12 | 85,218 |
| Project Engineer | 1 | 23G | 12 | 79,352 | 1 | 23G | 12 | 81,723 |
| Traffic Control Foreman, Second In Command | 1 | 74,048 | 12 | 74,048 | 1 | 75,525 | 12 | 75,525 |
| Painter Foreman, Second In Command | 1 | 74,048 | 12 | 74,048 | 1 | 75,525 | 12 | 75,525 |
| Staff Engineer | 3 | 71,414 | 12 | 214,242 | 3 | 73,556 | 12 | 220,668 |
| Traffic Control Foreman | 1 | 71,822 | 2,080 | 71,822 | 1 | 73,258 | 2,080 | 73,258 |
| Painter Foreman | 1 | 71,822 | 2,080 | 71,822 | 1 | 73,258 | 2,080 | 73,258 |
| Engineering Technician 3 | 2 | 20G | 12 | 140,400 | 3 | 20G | 12 | 216,903 |
| Traffic Control Electrician 2 | 10 | 31.36 | 20,800 | 652,288 | 10 | 32.61 | 20,800 | 678,288 |
| Sign & Paint Maintenance Specialist | 6 | 28.24 | 12,480 | 352,435 | 6 | 29.37 | 12,480 | 366,538 |
| Sign Painter | 2 | 28.24 | 4,160 | 117,478 | 2 | 29.37 | 4,160 | 122,179 |
| Truck Driver - Special Operator | 1 | 27.92 | 2,080 | 58,074 | 1 | 29.03 | 2,080 | 60,382 |
| Laborer | 5 | 24.96 | 2,080 | 259,584 | 5 | 25.96 | 2,080 | 269,984 |
| Total Full-Time Permanent Positions | 126 | 9,330,599 | 126 | 9,678,486 |
Position Summary
Lists authorized positions with FTE counts and pay grades.
| Title | 2026 FTE | Rate/ Grade | Hours/ Months | 2026 Budget | 2027 FTE | Rate/ Grade | Hours/ Months | 2027 Budget |
|---|---|---|---|---|---|---|---|---|
| Temporary, Part-Time, and Seasonal Allowances | ||||||||
| Seasonal Laborers | — | 24.96 | 6,240 | 155,750 | — | 25.92 | 6,240 | 161,741 |
| Seasonal Truck Driver - Special Operator | — | 27.92 | 1,040 | 29,037 | — | 29.03 | 1,040 | 30,191 |
| Intern | — | 12.00-15.00 | — | 23,033 | — | 12.00-15.00 | — | 23,105 |
| — | 207,820 | — | 215,037 | |||||
| Total Full-Time Permanent Positions | 126 | 9,330,599 | 126 | 9,678,486 | ||||
| Temporary, Part-Time, and Seasonal Allowances | — | 207,820 | — | 215,037 | ||||
| Vacancy Allowance | — | (599,475) | — | (289,294) | ||||
| Total Full-Time Positions and Net Salaries | 126 | 8,938,944 | 126 | 9,604,229 |
Position Summary
Subclass Detail
Compares actual, budgeted, and proposed spending across fiscal years.
| 2025 Actual | 2026 Budget | 2027 Budget | Increase/ (Decrease) | % Change | |
|---|---|---|---|---|---|
| Expenditures | |||||
| 51 - PERSONNEL-SALARIES & WAGES | 8,312,019 | 9,208,637 | 9,915,156 | 706,518 | 7.7% |
| 51101 - Regular | 7,943,413 | 8,731,120 | 9,389,171 | 658,052 | |
| 51103 - Part-Time | 133,918 | 207,821 | 215,038 | 7,217 | |
| 51111 - In Grade | 193 | — | — | — | |
| 51201 - Longevity | 7,250 | 12,500 | 18,750 | 6,250 | |
| 51203 - Allowances | 2,155 | 3,146 | 3,146 | — | |
| 51205 - Uniform | — | 7,150 | 7,150 | — | |
| 51207 - Leave Buyback | 9,766 | — | 35,000 | 35,000 | |
| 51401 - Premium Pay | 215,324 | 246,901 | 246,901 | — | |
| 52 - PERSONNEL-EMPLOYEE BENEFITS | 2,171,771 | 2,530,974 | 3,024,784 | 493,811 | 19.5% |
| 52101 - Health Insurance | 1,238,807 | 1,529,035 | 1,895,407 | 366,372 | |
| 52111 - Other Insurance/Benefits | 173,422 | 175,330 | 191,256 | 15,926 | |
| 52201 - Social Security | 607,941 | 702,379 | 791,849 | 89,471 | |
| 52301 - Medical-Workers' Compensation | 11,666 | — | — | — | |
| 52305 - Indemnity-Workers' Compensation | 6,159 | — | — | — | |
| 52601 - Personal Leave Buyback | 128,079 | 124,230 | 146,272 | 22,042 | |
| 52602 - Tuition Reimbursement | 5,697 | — | — | — | |
| 53 - PROFESSIONAL & TECHNICAL SERVICES | 230,261 | 256,000 | 199,000 | (57,000) | (22.3)% |
| 53101 - Administrative Fees | 154,476 | 84,000 | 64,000 | (20,000) | |
| 53301 - Workforce Training | 44,303 | 20,000 | 40,000 | 20,000 | |
| 53509 - Computer Maintenance | 27,488 | 95,000 | 95,000 | — | |
| 53517 - Legal Fees | 3,000 | — | — | ||
| 53701 - Repairs | 995 | — | — | — | |
| 53901 - Professional Services | — | 57,000 | — | (57,000) | |
| 54 - PROPERTY SERVICES | 936,195 | 2,793,000 | 3,566,000 | 773,000 | 27.7% |
| 54101 - Cleaning | 25,355 | — | — | ||
| 54201 - Maintenance | 525,406 | 1,900,000 | 1,900,000 | — | |
| 54204 - Demolition | (2,490) | — | — | — | |
| 54205 - Engineering | 33,497 | 50,000 | 25,000 | (25,000) | |
| 54207 - Construction | 276,828 | — | — | — | |
| 54509 - Vehicles | 3,555 | — | — | ||
| 54513 - Machinery & Equipment | 74,044 | 843,000 | 1,641,000 | 798,000 | |
| 55 - OTHER SERVICES | 16,115 | 20,500 | 20,500 | — | —% |
| 55309 - Regulatory | — | 500 | 500 | — | |
| 55501 - Printing & Binding | — | 5,000 | 5,000 | — | |
| 55701 - Transportation | 16,115 | 15,000 | 15,000 | — | |
| 56 - SUPPLIES | 605,947 | 533,125 | 665,125 | 132,000 | 24.8% |
| 56101 - Office Supplies | 10,078 | 18,000 | 18,000 | — | |
| 56103 - Freight | 761 | — | — | — | |
| 56105 - Postage | 50 | — | — | — | |
| 56151 - Operational Supplies | 191,312 | 120,125 | 145,125 | 25,000 | |
| 56351 - Tools | 7,936 | 45,000 | 45,000 | — | |
| 56401 - Materials | 395,810 | 350,000 | 457,000 | 107,000 | |
| 12,272,308 | 15,342,236 | 17,390,565 | 2,048,329 | 13.4% |
Five Year Forecast
DEPARTMENT OF MOBILITY & INFRASTRUCTURE 2027 Expenditures by Subclass
56 - SUPPLIES 55 - OTHER SERVICES
54 - PROPERTY SERVICES
53 - PROF. & TECHNICAL SERVICES 51 - PERSONNEL-SALARIES & WAGES
52 - PERSONNEL-EMPLOYEE BENEFITS
Projects budget figures across multiple future years.
| 2027 | 2028 | 2029 | 2030 | 2031 | |
|---|---|---|---|---|---|
| Expenditures | |||||
| 51 - PERSONNEL-SALARIES & WAGES | 9,915,156 | 10,122,312 | 10,232,827 | 10,342,624 | 10,446,445 |
| 52 - PERSONNEL-EMPLOYEE BENEFITS | 3,024,784 | 3,108,561 | 3,184,344 | 3,262,341 | 3,277,421 |
| 53 - PROF. & TECHNICAL SERVICES | 199,000 | 199,000 | 199,000 | 199,000 | 199,000 |
| 54 - PROPERTY SERVICES | 3,566,000 | 4,038,000 | 4,610,000 | 4,946,000 | 4,946,000 |
| 55 - OTHER SERVICES | 20,500 | 20,500 | 20,500 | 20,500 | 20,500 |
| 56 - SUPPLIES | 665,125 | 665,125 | 665,125 | 665,125 | 665,125 |
| Total | 17,390,565 | 18,153,498 | 18,911,797 | 19,435,590 | 19,554,491 |
| % Change from Prior Year | 13.4% | 4.4% | 4.2% | 2.8% | 0.6% |